
Page 49 - MOH Supply and Needs-Based Requirement Hyperlink 02032021
P. 49
41 EXTENDED EXECUTIVE SUMMARY
3.1 DOCTOR
3.1.1 Doctor Supply Projection
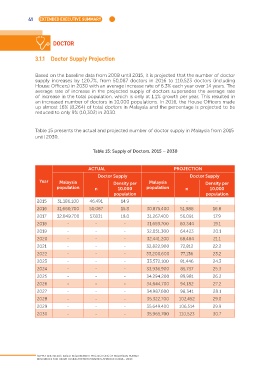
Based on the baseline data from 2008 until 2015, it is projected that the number of doctor
supply increases by 120.7%, from 50,087 doctors in 2016 to 110,523 doctors (including
House Officers) in 2030 with an average increase rate of 6.3% each year over 14 years. The
average rate of increase in the projected supply of doctors supersedes the average rate
of increase in the total population, which is only at 1.1% growth per year. This resulted in
an increased number of doctors in 10,000 populations. In 2016, the House Officers made
up almost 16% (8,264) of total doctors in Malaysia and the percentage is projected to be
reduced to only 9% (10,302) in 2030.
Table 15 presents the actual and projected number of doctor supply in Malaysia from 2015
until 2030.
Table 15: Supply of Doctors, 2015 – 2030
ACTUAL PROJECTION
Doctor Supply Doctor Supply
Year Malaysia Density per Malaysia Density per
population n 10,000 population n 10,000
population population
2015 31,186,100 46,491 14.9 - - -
2016 31,660,700 50,087 15.8 30,875,400 51,988 16.8
2017 32,049,700 57,831 18.0 31,267,400 56,091 17.9
2018 - - - 31,659,700 60,344 19.1
2019 - - - 32,051,300 64,423 20.1
2020 - - - 32,441,200 68,484 21.1
2021 - - - 32,822,900 72,812 22.2
2022 - - - 33,200,600 77,136 23.2
2023 - - - 33,572,100 81,446 24.3
2024 - - - 33,936,900 85,737 25.3
2025 - - - 34,294,200 89,981 26.2
2026 - - - 34,644,700 94,182 27.2
2027 - - - 34,987,600 98,341 28.1
2028 - - - 35,322,700 102,452 29.0
2029 - - - 35,649,400 106,514 29.9
2030 - - - 35,965,700 110,523 30.7
SUPPLY AND NEEDS-BASED REQUIREMENT PROJECTIONS OF MALAYSIAN HUMAN
RESOURCES FOR HEALTH USING SYSTEM DYNAMICS APPROACH 2016 - 2030