
Page 56 - MOH Supply and Needs-Based Requirement Hyperlink 02032021
P. 56
EXTENDED EXECUTIVE SUMMARY 48
3.2. DENTIST
3.2.1 Dentist Supply Projection
This study utilised a mixed source of data to identify the number of patients within the
target population who requires specific oral health care services. Input variables were
supported by published and unpublished data; however, in some area, due to limited
data availability; the oral health care providers’ judgements were used to identify the
population health care needs. The oral health care needs between targeted populations
may differ. However, through the Needs-based approach, oral health care providers
would be able to address the oral health care needs of the targeted population. The
projection of dentist supply and requirement based on needs and demands were primarily
focused on fully registered Human Resource for Health (HRH), who are professionals
and competent to provide oral health care services to the targeted population.
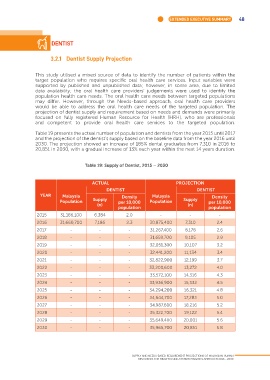
Table 19 presents the actual number of population and dentists from the year 2015 until 2017
and the projection of the dentist’s supply based on the baseline data from the year 2016 until
2030. The projection showed an increase of 185% dental graduates from 7,310 in 2016 to
20,851 in 2030, with a gradual increase of 13% each year within the next 14 years duration.
Table 19: Supply of Dentist, 2015 – 2030
ACTUAL PROJECTION
DENTIST DENTIST
YEAR Malaysia Density Malaysia Density
Population Supply per 10,000 Population Supply per 10,000
(n) (n)
population population
2015 31,186,100 6,384 2.0 - - -
2016 31,660,700 7,186 2.3 30,875,400 7,310 2.4
2017 - - - 31,267,400 8,178 2.6
2018 - - - 31,659,700 9,105 2.9
2019 - - - 32,051,300 10,107 3.2
2020 - - - 32,441,200 11,134 3.4
2021 - - - 32,822,900 12,199 3.7
2022 - - - 33,200,600 13,272 4.0
2023 - - - 33,572,100 14,316 4.3
2024 - - - 33,936,900 15,332 4.5
2025 - - - 34,294,200 16,321 4.8
2026 - - - 34,644,700 17,283 5.0
2027 - - - 34,987,600 18,216 5.2
2028 - - - 35,322,700 19,122 5.4
2029 - - - 35,649,400 20,001 5.6
2030 - - - 35,965,700 20,851 5.8
SUPPLY AND NEEDS-BASED REQUIREMENT PROJECTIONS OF MALAYSIAN HUMAN
RESOURCES FOR HEALTH USING SYSTEM DYNAMICS APPROACH 2016 - 2030