
Page 57 - MOH Supply and Needs-Based Requirement Hyperlink 02032021
P. 57
49 EXTENDED EXECUTIVE SUMMARY
3.2.2 Dentist Requirement Projection
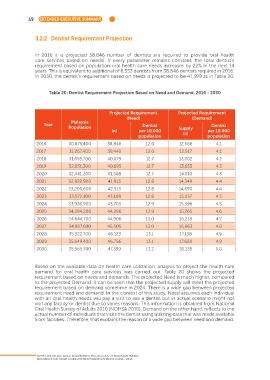
In 2016 it is projected 38,846 number of dentists are required to provide oral health
care services based on needs). If every parameter remains constant, the total dentist’s
requirement based on population oral health care needs increases by 22% in the next 14
years. This is equivalent to additional of 8,553 dentists from 38,846 dentists required in 2016.
In 2030, the dentist’s requirement based on needs is projected to be 47,399 as in Table 20.
Table 20: Dentist Requirement Projection Based on Need and Demand, 2016 - 2030
Projected Requirement Projected Requirement
(Need) (Demand)
Malaysia
Year Dentist Dentist
Population Supply
(n) per 10,000 (n) per 10,000
population population
2016 30,875,400 38,846 12.6 12,568 4.1
2017 31,267,400 39,448 12.6 12,917 4.1
2018 31,659,700 40,079 12.7 13,302 4.2
2019 32,051,300 40,695 12.7 13,653 4.3
2020 32,441,200 41,308 12.7 14,010 4.3
2021 32,822,900 41,913 12.8 14,349 4.4
2022 33,200,600 42,513 12.8 14,690 4.4
2023 33,572,100 43,108 12.8 15,037 4.5
2024 33,936,900 43,703 12.9 15,396 4.5
2025 34,294,200 44,296 12.9 15,765 4.6
2026 34,644,700 44,906 13.0 16,218 4.7
2027 34,987,600 45,505 13.0 16,663 4.8
2028 35,322,700 46,123 13.1 17,138 4.9
2029 35,649,400 46,756 13.1 17,628 4.9
2030 35,965,700 47,399 13.2 18,128 5.0
Based on the available data on health care utilization, analysis to project the health care
demand for oral health care services was carried out. Table 20 shows the projected
requirement based on needs and demands. The projected Need is much higher, compared
to the projected Demand. It can be seen that the projected supply will meet the projected
requirement based on demand sometime in 2024. There is a wide gap between projected
requirement need and demand. In the context of this study, Need assumes each individual
with an oral health needs will pay a visit to see a dentist but in actual scenario might not
visit any facility or dentist due to varies reasons. This information is obtained from National
Oral Health Survey of Adults 2010 (NOHSA 2010). Demand on the other hand, reflects to the
actual number of individuals that visits the dentist using utilizing data that was made available
from facilities. Therefore, that explains the reason of a wide gap between need and demand.
SUPPLY AND NEEDS-BASED REQUIREMENT PROJECTIONS OF MALAYSIAN HUMAN
RESOURCES FOR HEALTH USING SYSTEM DYNAMICS APPROACH 2016 - 2030