
Page 58 - MOH Supply and Needs-Based Requirement Hyperlink 02032021
P. 58
EXTENDED EXECUTIVE SUMMARY 50
3.2.3 Gap Analysis
a. Baseline supply and requirement
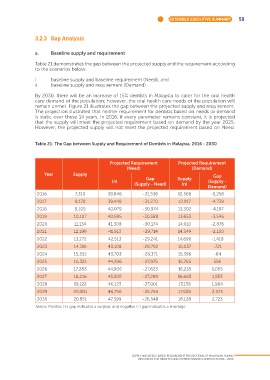
Table 21 demonstrates the gap between the projected supply and the requirement according
to the scenarios below:
i. baseline supply and baseline requirement (Need), and
ii. baseline supply and requirement (Demand)
By 2030, there will be an increase of 15% dentists in Malaysia to cater for the oral health
care demand of the population; however, the oral health care needs of the population will
remain unmet. Figure 21 illustrates the gap between the projected supply and requirement.
The projection illustrated that neither requirement for dentists based on needs or demand
is static over these 14 years. In 2016, if every parameter remains constant, it is projected
that the supply will meet the projected requirement based on demand by the year 2025.
However, the projected supply will not meet the projected requirement based on Need.
Table 21: The Gap between Supply and Requirement of Dentists in Malaysia, 2016 - 2030
Projected Requirement Projected Requirement
(Need) (Demand)
Year Supply Gap
Gap Supply
(n) (Supply -
(Supply - Need) (n)
Demand)
2016 7,310 38,846 -31,536 12,568 -5,258
2017 8,178 39,448 -31,270 12,917 -4,739
2018 9,105 40,079 -30,974 13,302 -4,197
2019 10,107 40,695 -30,588 13,653 -3,546
2020 11,134 41,308 -30,174 14,010 -2,876
2021 12,199 41,913 -29,714 14,349 -2,150
2022 13,272 42,513 -29,241 14,690 -1,418
2023 14,316 43,108 -28,792 15,037 -721
2024 15,332 43,703 -28,371 15,396 -64
2025 16,321 44,296 -27,975 15,765 556
2026 17,283 44,906 -27,623 16,218 1,065
2027 18,216 45,505 -27,289 16,663 1,553
2028 19,122 46,123 -27,001 17,138 1,984
2029 20,001 46,756 -26,755 17,628 2,373
2030 20,851 47,399 -26,548 18,128 2,723
Notes: Positive (+) gap indicates a surplus, and negative (-) gap indicates a shortage
SUPPLY AND NEEDS-BASED REQUIREMENT PROJECTIONS OF MALAYSIAN HUMAN
RESOURCES FOR HEALTH USING SYSTEM DYNAMICS APPROACH 2016 - 2030